Ecommerce Dashboard
An e-commerce sales dashboard in Power BI is a visual analytics tool that provides a comprehensive and real-time overview of key performance indicators (KPIs) related to online sales activities
- Power BI
- Excel
- Power Query Editor
e-Commerce Sales Dashboard
An e-commerce sales dashboard in Power BI is a visual analytics tool that provides a comprehensive and real-time overview of key performance indicators (KPIs) related to online sales activities.
Introduction
The Power BI E-commerce Sales Dashboard is a powerful tool designed to transform raw data into actionable insights for online retailers. This dynamic dashboard provides a visually compelling and interactive representation of essential e-commerce metrics, enabling businesses to effortlessly monitor and analyze their sales performance. With intuitive charts, graphs, and real-time updates, stakeholders can gain a comprehensive understanding of key indicators such as revenue, order volume, and product trends.
In this dashboard, we will showcase:
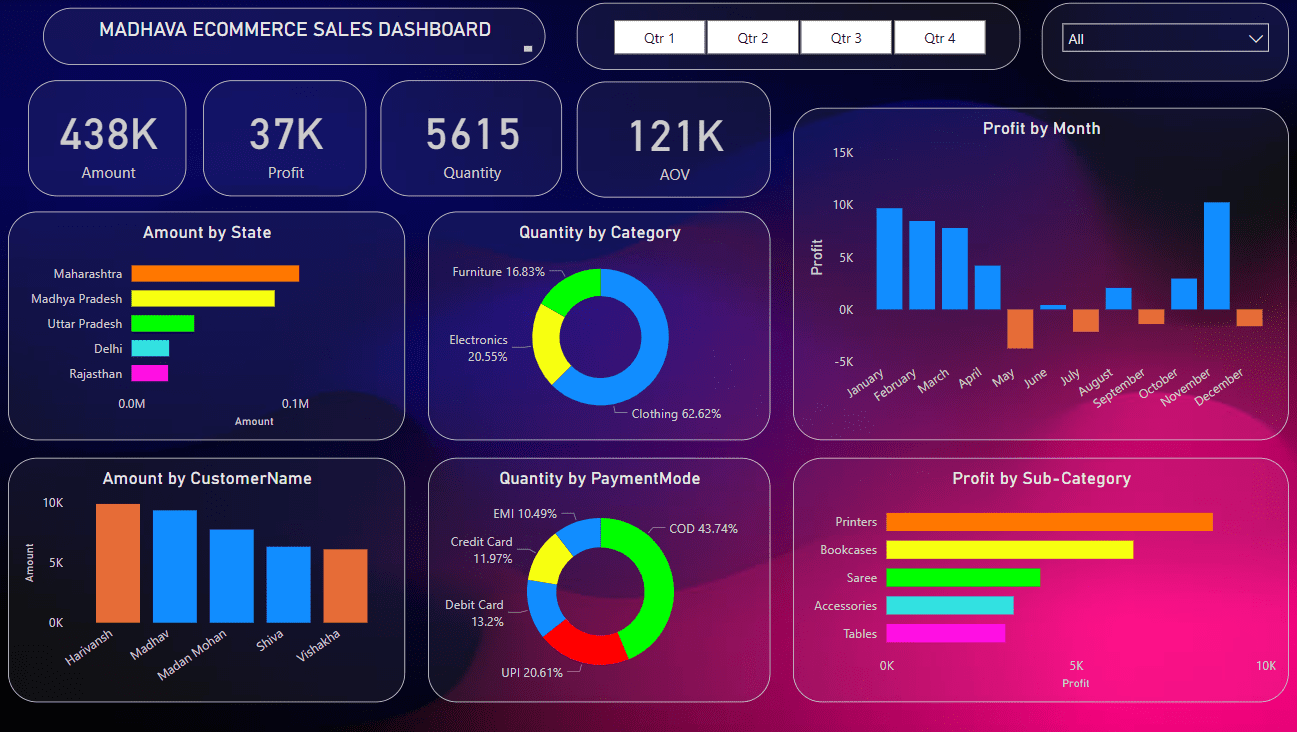
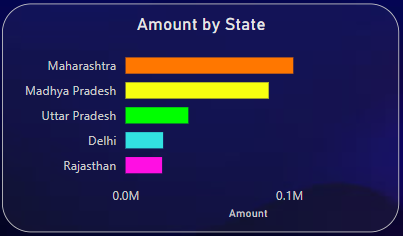
Sales Trends: You will be able to see the top 5 states in which sales was highest in terms of Amount. We see Maharashtra state tops the Sales Amount compared to other states.
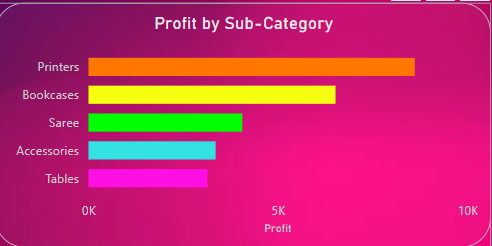
Profit by Sub-Category: Analyzing the Sales by Sub-Category, we observe that Printers sales was high , which returned high profit. Bookcases and Sarees stands second and third place respectively in terms of total profit.
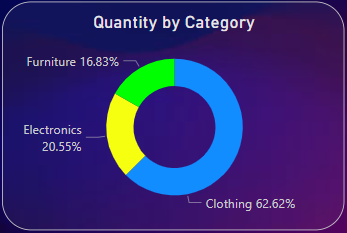
Sales Quantity by Category: We observe that almost 63% of the sales come from Clothing category, which is the major contributor of the profit share. Then comes the Electronics and Furniture category with Approximately 21% and 16% respectively.
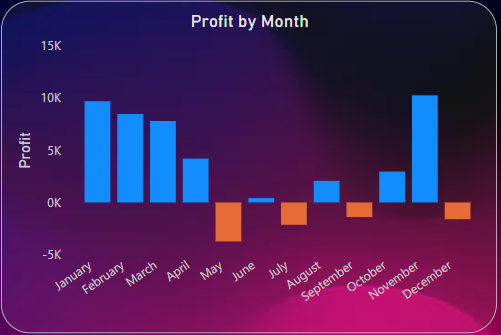
Sales by Months: Sales is high in the month of November as its a festival season. people prefer to purchase more items and even in the first 3 months of the year notably the sales was good. In the month of May we could see revenue loss.
E-commerce Sales Dashboard stands as a vital asset for online retailers seeking to navigate the complexities of their business landscape. By harnessing the power of visual analytics, this tool not only simplifies the interpretation of intricate sales data but also equips decision-makers with the tools needed to adapt and thrive in the dynamic e-commerce environment.