All Works

project-image

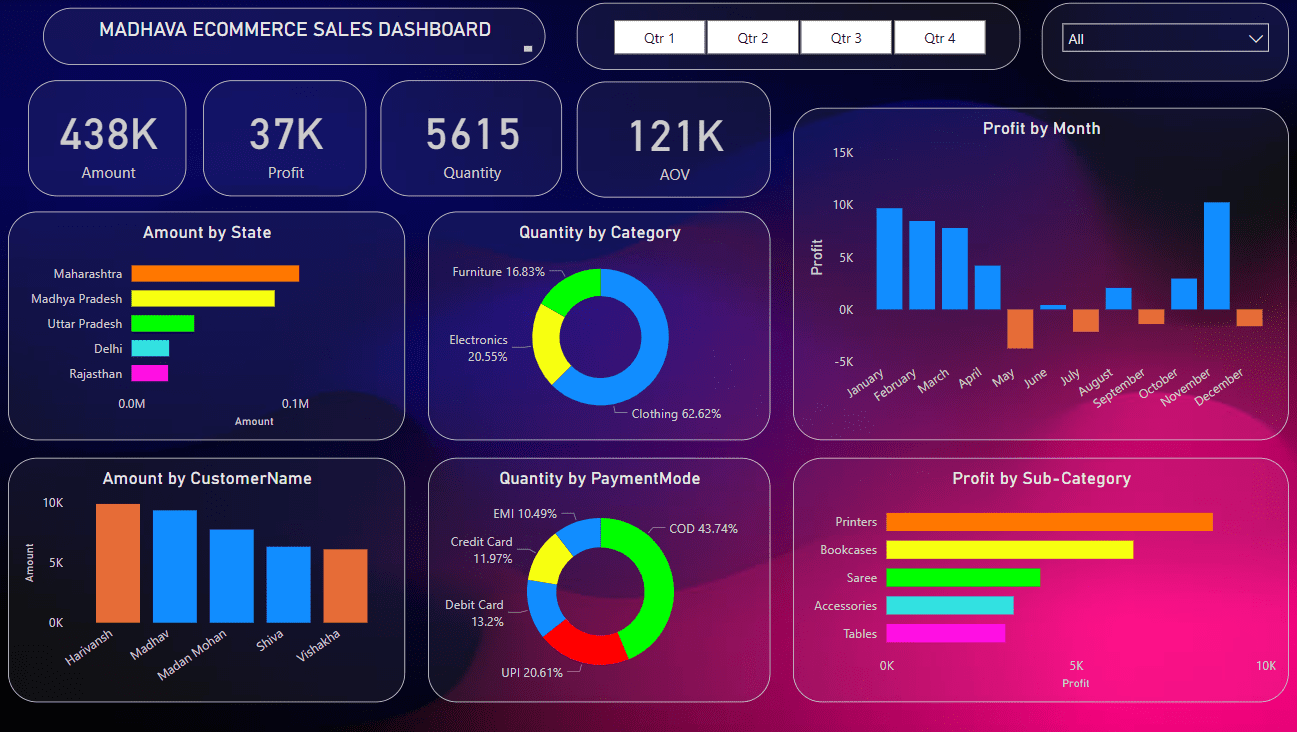
Ecommerce Dashboard

/01

An e-commerce sales dashboard in Power BI is a visual analytics tool that provides a comprehensive and real-time overview of key performance indicators (KPIs) related to online sales activities

  • Power BI
  • Excel
  • Power Query Editor
project-image

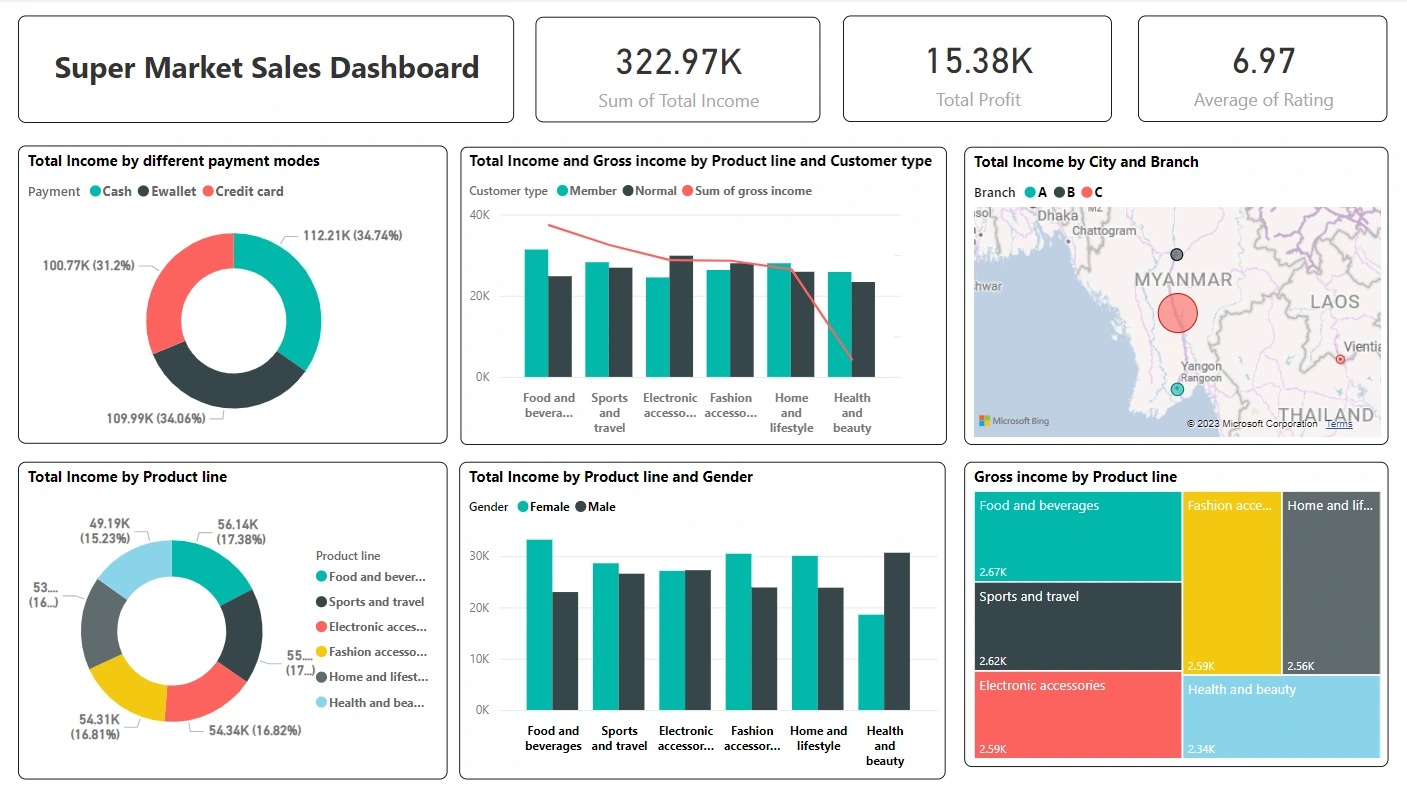
Sales Dashboard

/02

A Sales Data Dashboard for a business operating in Myanmar serves as a crucial tool for monitoring and analyzing various sales-related metrics and key performance indicators (KPIs) within the Myanmar market.

  • Excel
  • PowerBI
  • Data Cleaning
  • Data Analysis
  • Dashboard
project-image

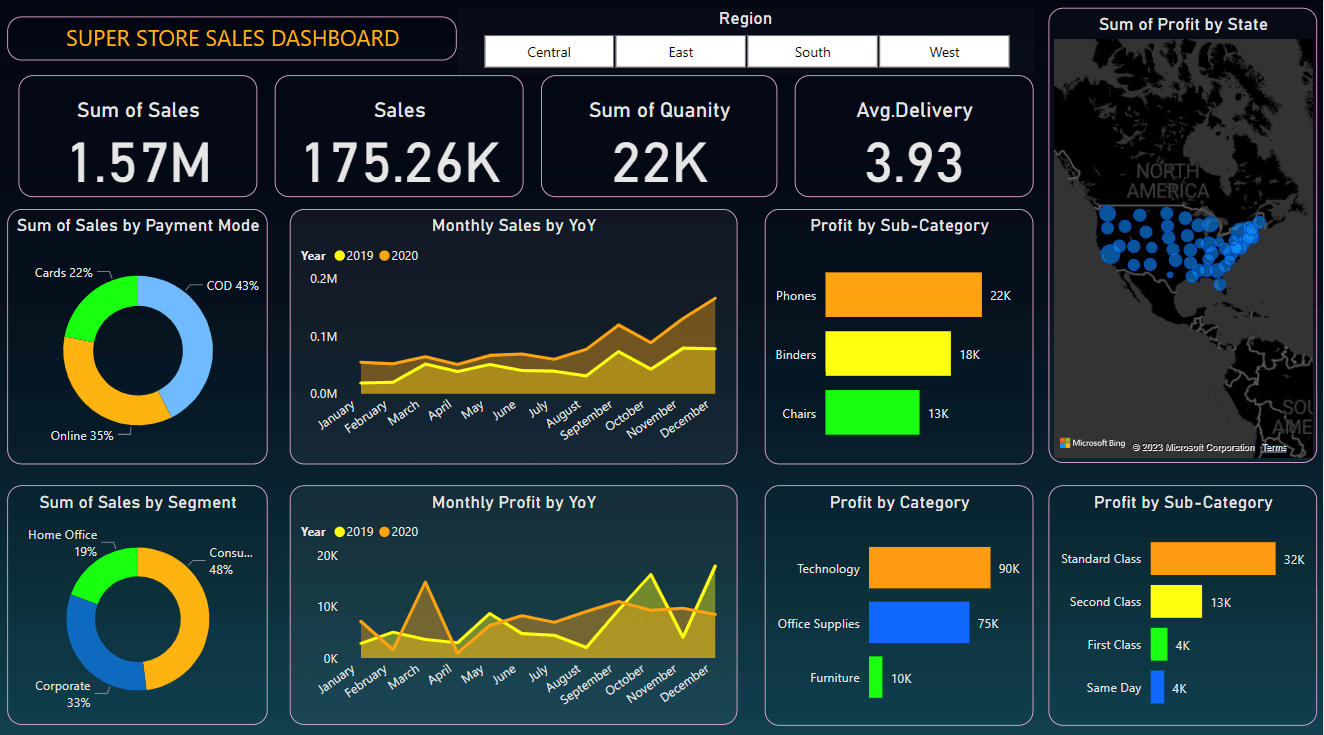
Super Store Dashboard

/03

A Super Store sales dashboard visually summarizes key performance indicators and sales metrics for quick analysis and informed decision-making in retail.

  • Power BI
  • Excel
  • Data Cleaning
  • Data Analysis
  • Power Query Editor
  • Dashboard
project-image

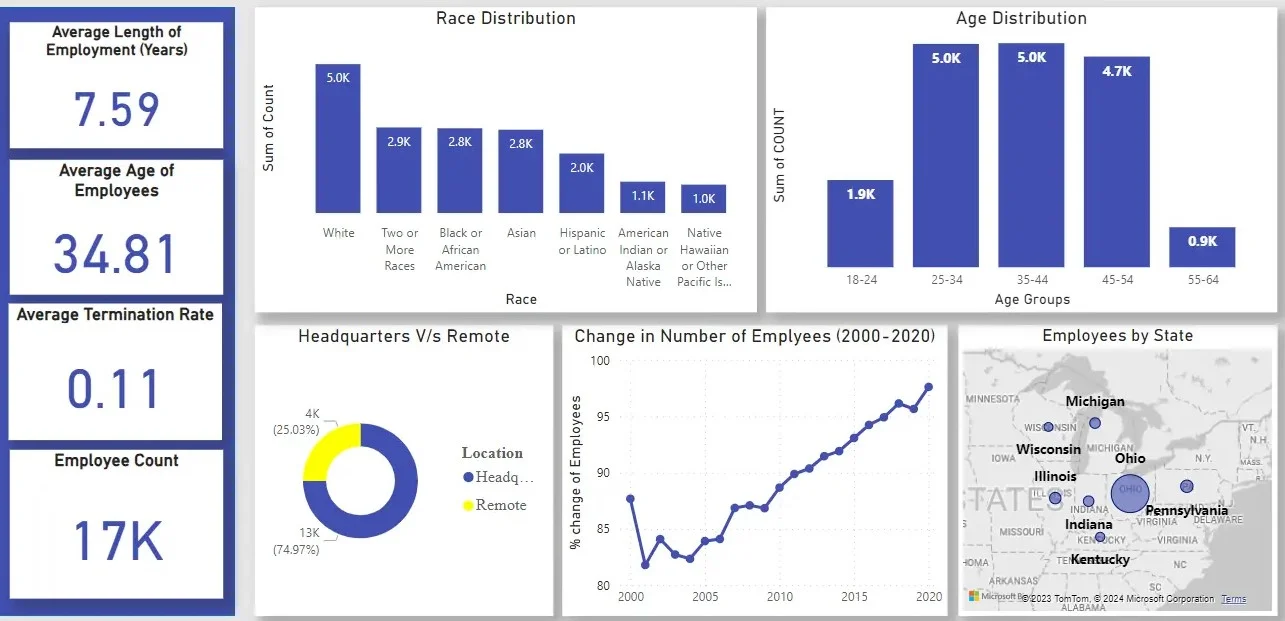
HR Employee Distribution

/04

The HR Employee Distribution Dashboard is a visually engaging tool designed to offer real-time insights into your workforce. This dashboard leverages Power BI's capabilities to present key metrics, such as departmental headcounts, role distributions, and geographical spread in an interactive format.

  • Power BI
  • SQL
  • Excel