Super Store Dashboard
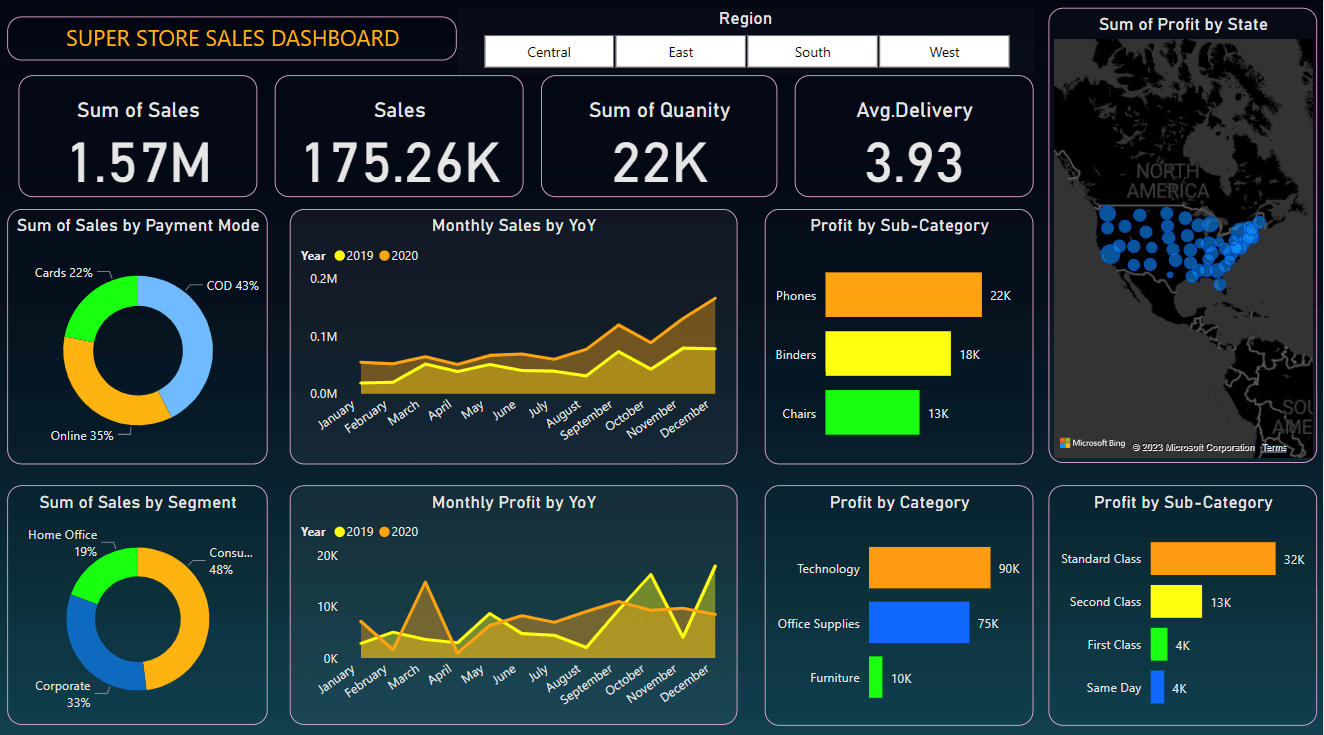
A Super Store sales dashboard visually summarizes key performance indicators and sales metrics for quick analysis and informed decision-making in retail.
- Power BI
- Excel
- Data Cleaning
- Data Analysis
- Power Query Editor
- Dashboard
Super Store Sales Dashboard
A Super Store sales dashboard is a visual representation of key performance indicators and sales metrics for a retail business. It provides a concise and interactive overview of various aspects of the store’s sales performance, allowing stakeholders to quickly analyze and make informed decisions.
Introduction:
This dashboard serves as a centralized hub, offering at-a-glance access to critical metrics such as total sales, revenue, and profit margins. Through intuitive charts, graphs, and tables, it transforms raw data into actionable insights, enabling stakeholders to swiftly grasp trends, identify patterns, and make informed decisions.
In this dashboard, we will showcase:
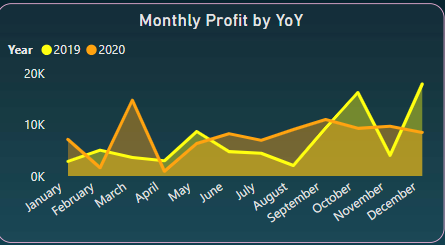
Monthly profit: Analyzing the dashboard, we are able to compare the month wise profit for both the years 2019 and 2020. The profit varies from month to month for both the years.
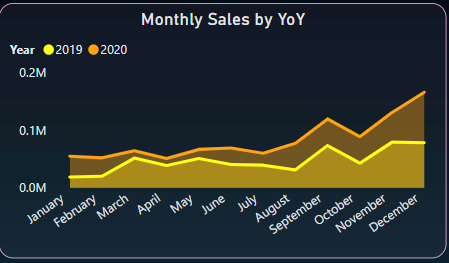
Monthly Sales: By observing the dashboard, we are able to observe that Monthly Sales for 2020 year is higher than 2019 for all the months.
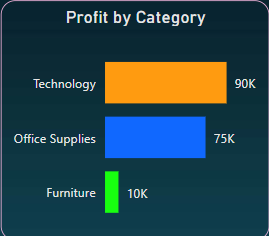
Profit by Category: Profit by Category visual, we can observe that Technology category recorded the highest profit and thereafter Office Supplies and Furniture comes in the 2nd and 3rd place respectively.
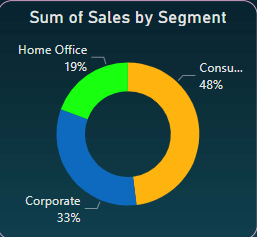
Sales by Segment: Consumers occupy 48% of the sales and Home Office, Corporates occupy the 19% and 33% of sales respectively.
Sales Forecasting: Power BI has the special feature , where using its BI feature we can predict the future forecast for the data. We have forecasted the sales for next 100 days from the last given date from data set.

The Super Store Sales Dashboard stands as a pivotal asset in the modern retail ecosystem, offering a streamlined and visually engaging platform for monitoring and optimizing sales performance. By distilling complex data into digestible insights, this dashboard empowers decision-makers to act with agility and precision. Its interactive features not only facilitate a comprehensive overview but also enable a granular analysis, ensuring that every aspect of the retail landscape is thoroughly understood.