HR Employee Distribution
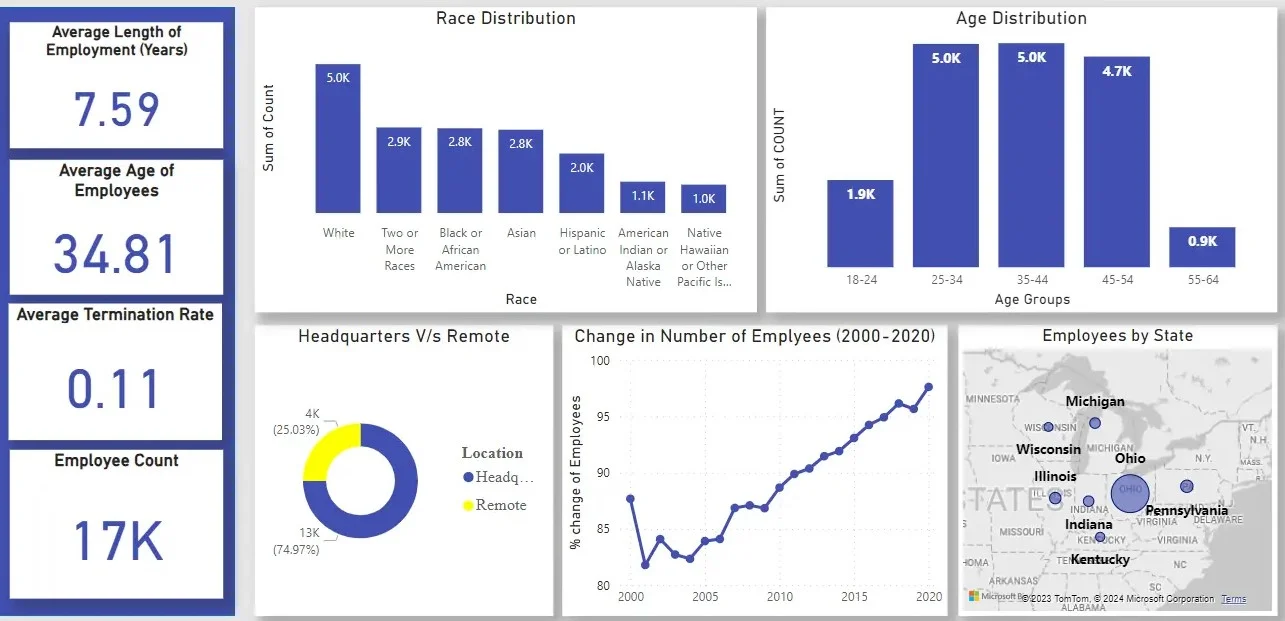
The HR Employee Distribution Dashboard is a visually engaging tool designed to offer real-time insights into your workforce. This dashboard leverages Power BI's capabilities to present key metrics, such as departmental headcounts, role distributions, and geographical spread in an interactive format.
- Power BI
- SQL
- Excel
HR Employee Distribution Report
The HR Employee Distribution report provides a comprehensive overview of the organizational workforce distribution, detailing the number of employees across different departments, positions, and locations.
Introduction:
This report serves as a strategic tool for Human Resources professionals and organizational leaders, offering a detailed overview of employee distribution across various departments, positions, and geographical locations.
In this dashboard, we will showcase:
Age Distribution: By looking at the dashboard, we would see that age group 25-34 and 35-44 both the age groups have almost same number of employees and its around 5k.

Work Mode: From the report, we are able to see that almost 75% of the employees work from the headquarters and rest of the 25% of the employees work from Home.

Employee Number Growth: We could see in the report that in the year 2001 the hiring was reduced and after 2001, almost there is a linear growth in the hiring of employees.

Employees Distribution over states: In the visuals, we are able to observe that Ohio state has highest number of employees and whereas Wisconsin state has the lowest number of employees.

In conclusion, the HR Employee Distribution Report has provided a comprehensive and illuminating snapshot of our organizational workforce. By examining key metrics and visualizing trends, we have gained valuable insights into the distribution of talent across departments, positions, and locations. This information equips us with the knowledge needed to make informed decisions regarding resource allocation, talent development, and strategic planning.